Monitor consumption from the Statistics page
The Statistics page of the Clovis administration console provides details about your organization’s token consumption. It lets you compare ChattyBot and API key activity, then identify the users, keys, and models responsible for that consumption.
To open it, select Statistics from the console sidebar.
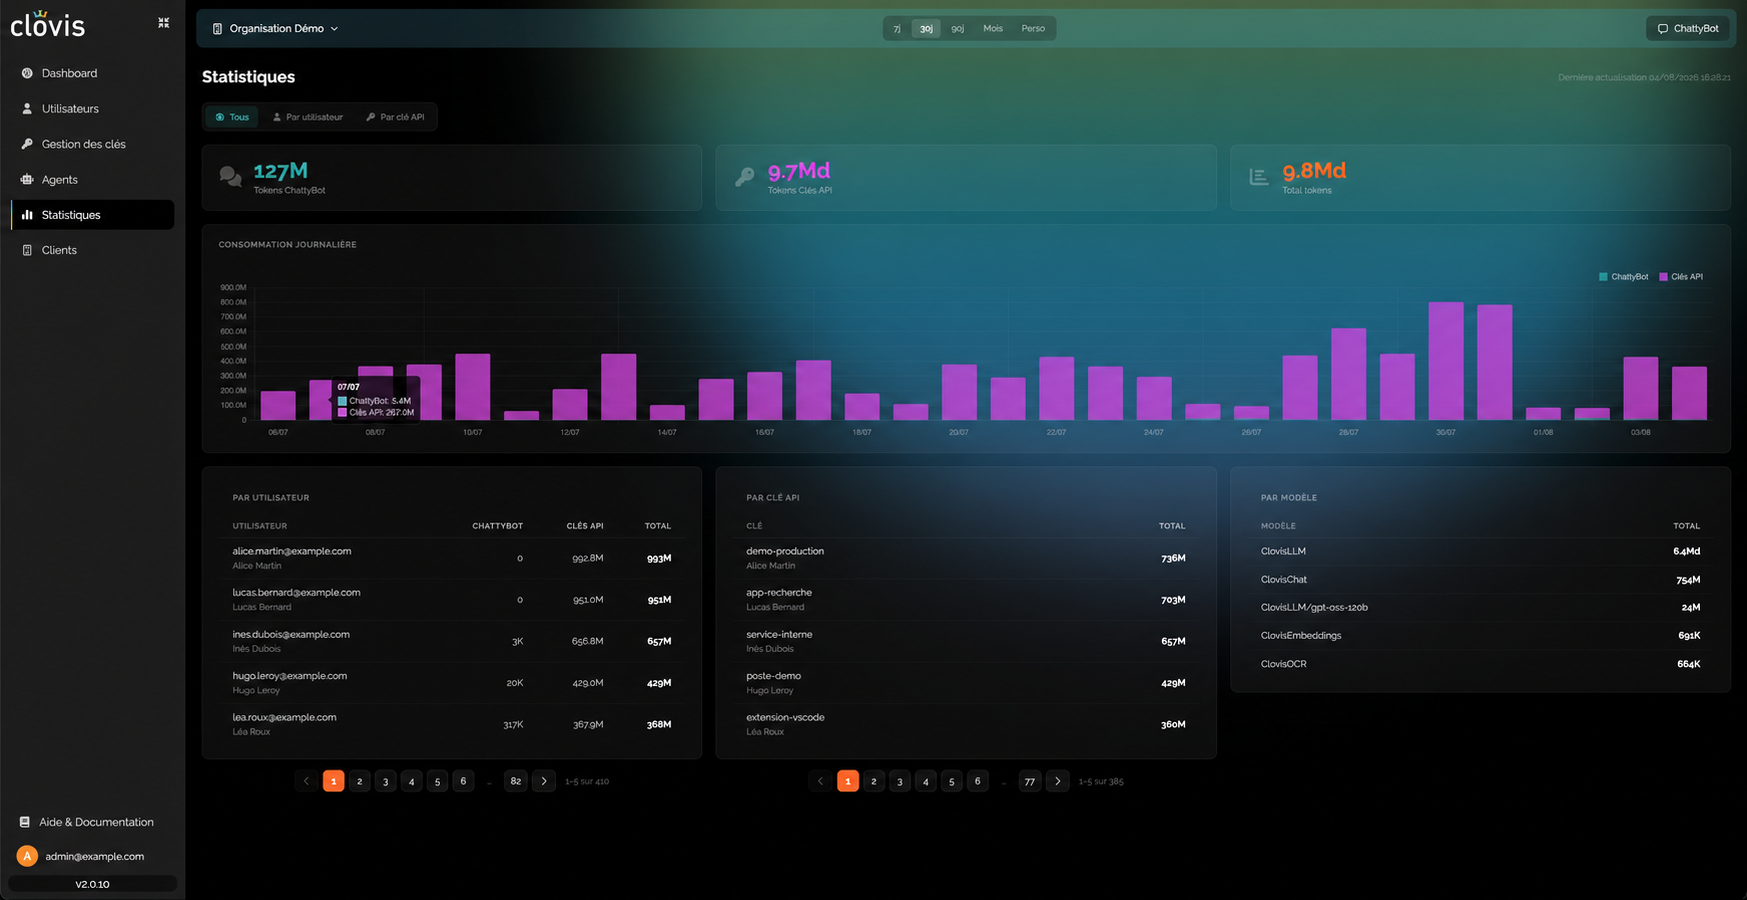
Define the analysis scope
Before interpreting the results, use the controls at the top of the page:
- the organization selector determines the environment being analyzed;
- the 7d, 30d, 90d, and Month shortcuts define the period shown;
- the Custom option lets you choose a custom period;
- the All, By user, and By API key views let you move from a summary to a more focused scope;
- Last updated indicates when the displayed data was refreshed.
If your account provides access to multiple organizations, check the organization and period before comparing figures or sharing an analysis.
Read the summary metrics
The three metrics above the chart break down consumption by source.
| Metric | Meaning |
|---|---|
| ChattyBot tokens | Number of tokens consumed from the ChattyBot conversational interface. |
| API key tokens | Number of tokens consumed by applications and integrations that use an API key. |
| Total tokens | Combined ChattyBot and API key consumption over the selected period. |
Volumes are abbreviated in the interface: K for thousands, M for millions, and B for billions. Because values are rounded, the sum of the displayed figures may differ slightly from the displayed total.
Identify changes over time
The Daily consumption chart shows the token volume used on each day of the period:
- the turquoise series represents ChattyBot;
- the purple series represents API keys.
Hover over a bar to display the date and a detailed breakdown of consumption for each channel. Use this view to identify a peak, an unusual drop, or a change in the balance between ChattyBot and API usage.
Identify the source of consumption
The tables below the chart provide three levels of detail.
By user
The By user table shows the following for each account:
- consumption from ChattyBot;
- consumption associated with the account’s API keys;
- combined total.
It helps identify an account whose activity accounts for a significant share of consumption.
By API key
The By API key table displays the key name, its owner, and the total volume consumed. Use it to identify the application, workstation, or integration responsible for a change related to API usage.
By model
The By model table breaks down consumption across Clovis models and services. It helps determine whether the activity comes mainly from text generation, chat, embeddings, or OCR.
The By user and By API key tables are paginated. Use the controls below each table to view additional results; the counter indicates the displayed range and the total number of items.
Perform an initial analysis
- Select the relevant organization and period.
- Compare ChattyBot tokens and API key tokens to identify the primary channel.
- Use the chart to identify the day or days when the change occurred.
- Check By model to determine which services are involved.
- Then cross-reference By user and By API key to find the likely source.
- Use the focused views and pagination if the item you are looking for does not appear in the first list.
- Record the period and the last updated time when sharing your analysis.
The organizations, users, keys, and data you can see depend on the permissions assigned to your account.
For a more concise overview, return to the administration console home. To check model and service availability, also visit the Service status page.