MCP Draw.io
 MCP Draw.io
Illustrate your architectures and interactions with an MCP dedicated to diagrams and flowcharts. MCP Draw.io lets you prepare an editable .drawio file and PNG or SVG previews.
We recommend using this MCP with ClovisChat to create and edit files from the chat.
Enable the MCP in your chat
Select MCP Servers in the input area, then enable clovis-drawio for the conversation. If you cannot see it, contact your Clovis representative to request access. See the MCP page for the activation steps.

Then copy one of the prompts below. The relevant MCP must already be enabled. All names and figures in these examples are fictional and can be replaced with your own data.
Diagrams
Diagram generation is still under development and should be used for testing only. Do not use it in production. Generated diagrams may contain errors in representation, placement, or connections between elements.
Make an architecture easier to explain with a diagram showing components and their connections.
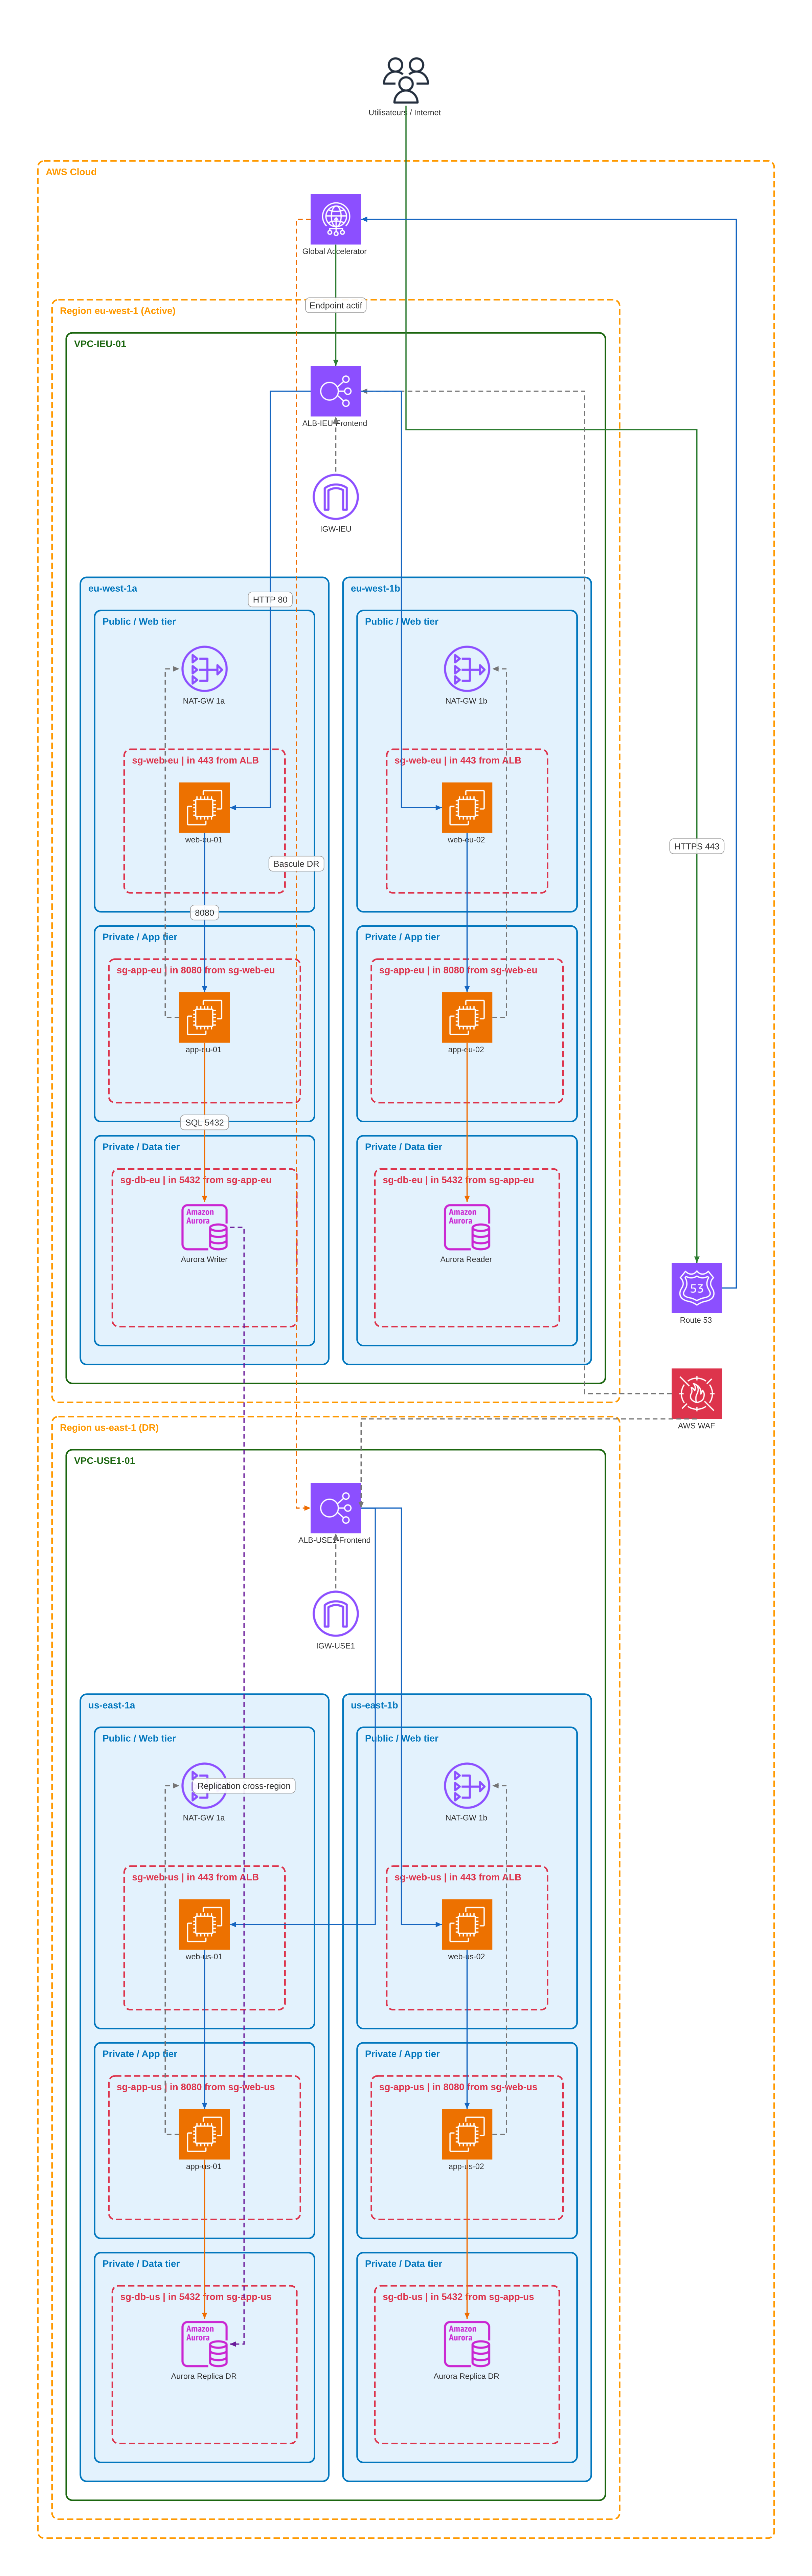
Example: three-tier AWS infrastructure across two regions
Create a three-tier AWS infrastructure diagram showing the VPCs and security groups.
It must be deployed across two AWS regions (eu-west-1 and us-east-1).
Here is the result generated with this prompt. Scroll within the diagram frame to explore both regions, or open the original image to enlarge it.
Example: illustrate an Azure customer portal
Use MCP Draw.io to create a simple diagram titled
“Customer portal — Azure architecture”.

Show these three groups from left to right:
- Access: an Azure Load Balancer.
- Application: an Azure App Service.
- Data: an Azure SQL Database and Azure Blob Storage.

Add only these connections:
- Load Balancer to App Service: “Incoming requests”.
- App Service to SQL Database: “Customer data”.
- App Service to Blob Storage: “Documents”.

Use the available Azure icons. Keep labels readable.
Align components, space out the groups, and avoid crossing arrows.
Do not add any other services: this is a deliberately simple conceptual diagram.
Provide the editable .drawio file and PNG and SVG previews.
Features
.drawio file and PNG or SVG renderings.Simple diagrams are the best starting point. Element and arrow placement may need adjustments in complex architectures.
More ideas to try
- Presentation aid: “Create a diagram limited to the application and its two storage services to explain the interactions to the team.”
- Architecture update: “Update the generated diagram, add an Azure Function connected to storage, and check that the connections are readable.”
Other creation MCPs
- MCP Docs: PDF and Word.
- MCP XLS: Excel workbooks.
- MCP Draw.io: diagrams and flowcharts.
- MCP PPTX: PowerPoint slide decks.