MCP XLS
 MCP XLS
Turn your data into ready-to-use Excel workbooks, directly in Clovis. MCP XLS is dedicated to Excel (.xlsx) files. For PDF reports and Word documents, use MCP Docs.
We recommend using this MCP with ClovisChat to prepare your workbooks from the chat.
This MCP is currently in beta. If it does not appear in your chat, contact your Clovis representative to request access.
Enable the MCP in your chat
- Select MCP Servers in the input area.
- Enable the MCP XLS server provided by your organization. Its name in the list may vary depending on your configuration.
- Provide your data and specify the expected sheets, columns, and formats.
- Send your request, then download the .xlsx file linked in the response.
See the MCP page for the activation steps.
Prepare your request
Specify sheet names, headers, units, and date formats. Distinguish source data from information to fill in, and explain how missing values should be handled.
If your organization has brand guidelines configured for this MCP, mention them in your request. Otherwise, specify the desired colors and formatting. In the example below, replace Claranet with your company name; mentioning it does not itself configure brand guidelines.
Create an Excel workbook
 Excel
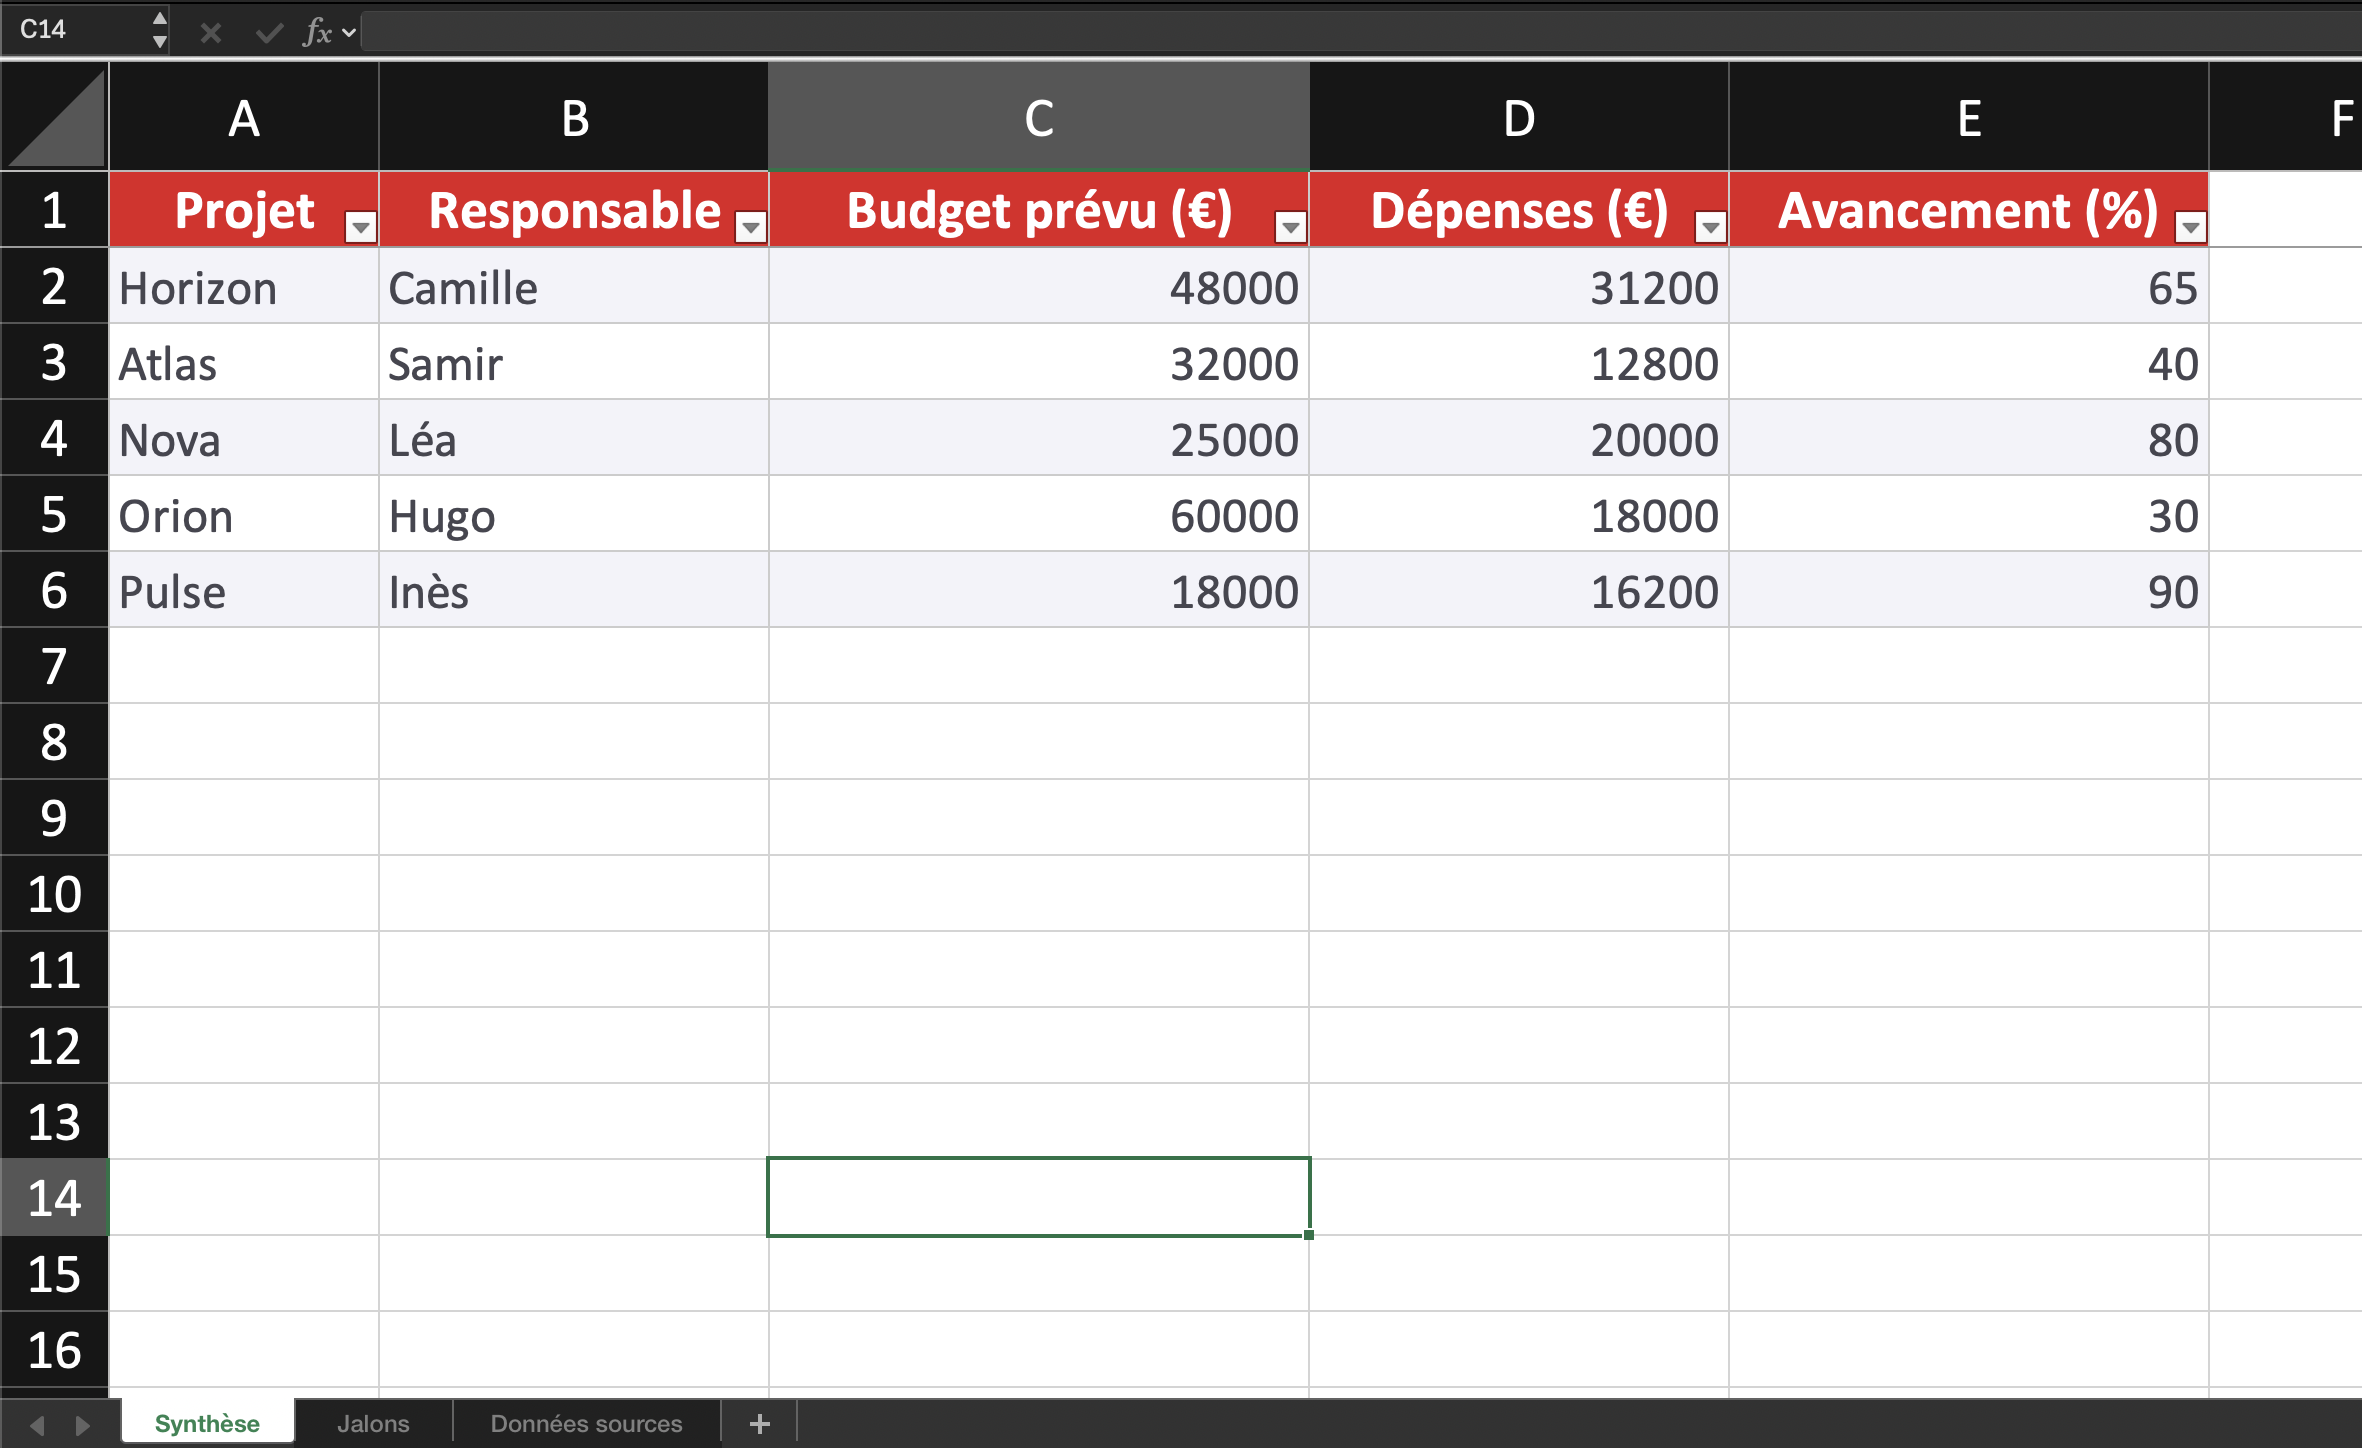
Summary sheet preview · Click to enlarge
Project portfolio — monthly tracking
Workbook generated from the Excel prompt: summary, milestones, and source data.
View sheetsGather your data into a workbook organized into multiple sheets, with tables that are easy to browse and filter.
Example: track a project portfolio
Use Claranet's brand guidelines (replace Claranet with your company name).

Use MCP XLS to create an Excel workbook titled
“Project portfolio — September 2026” with this fictional data.

Project; Owner; Planned budget (€); Spending (€); Progress (%)
Horizon; Camille; 48000; 31200; 65
Atlas; Samir; 32000; 12800; 40
Nova; Léa; 25000; 20000; 80
Orion; Hugo; 60000; 18000; 30
Pulse; Inès; 18000; 16200; 90

Create three sheets:
1. “Summary”: the table above, with all five columns.
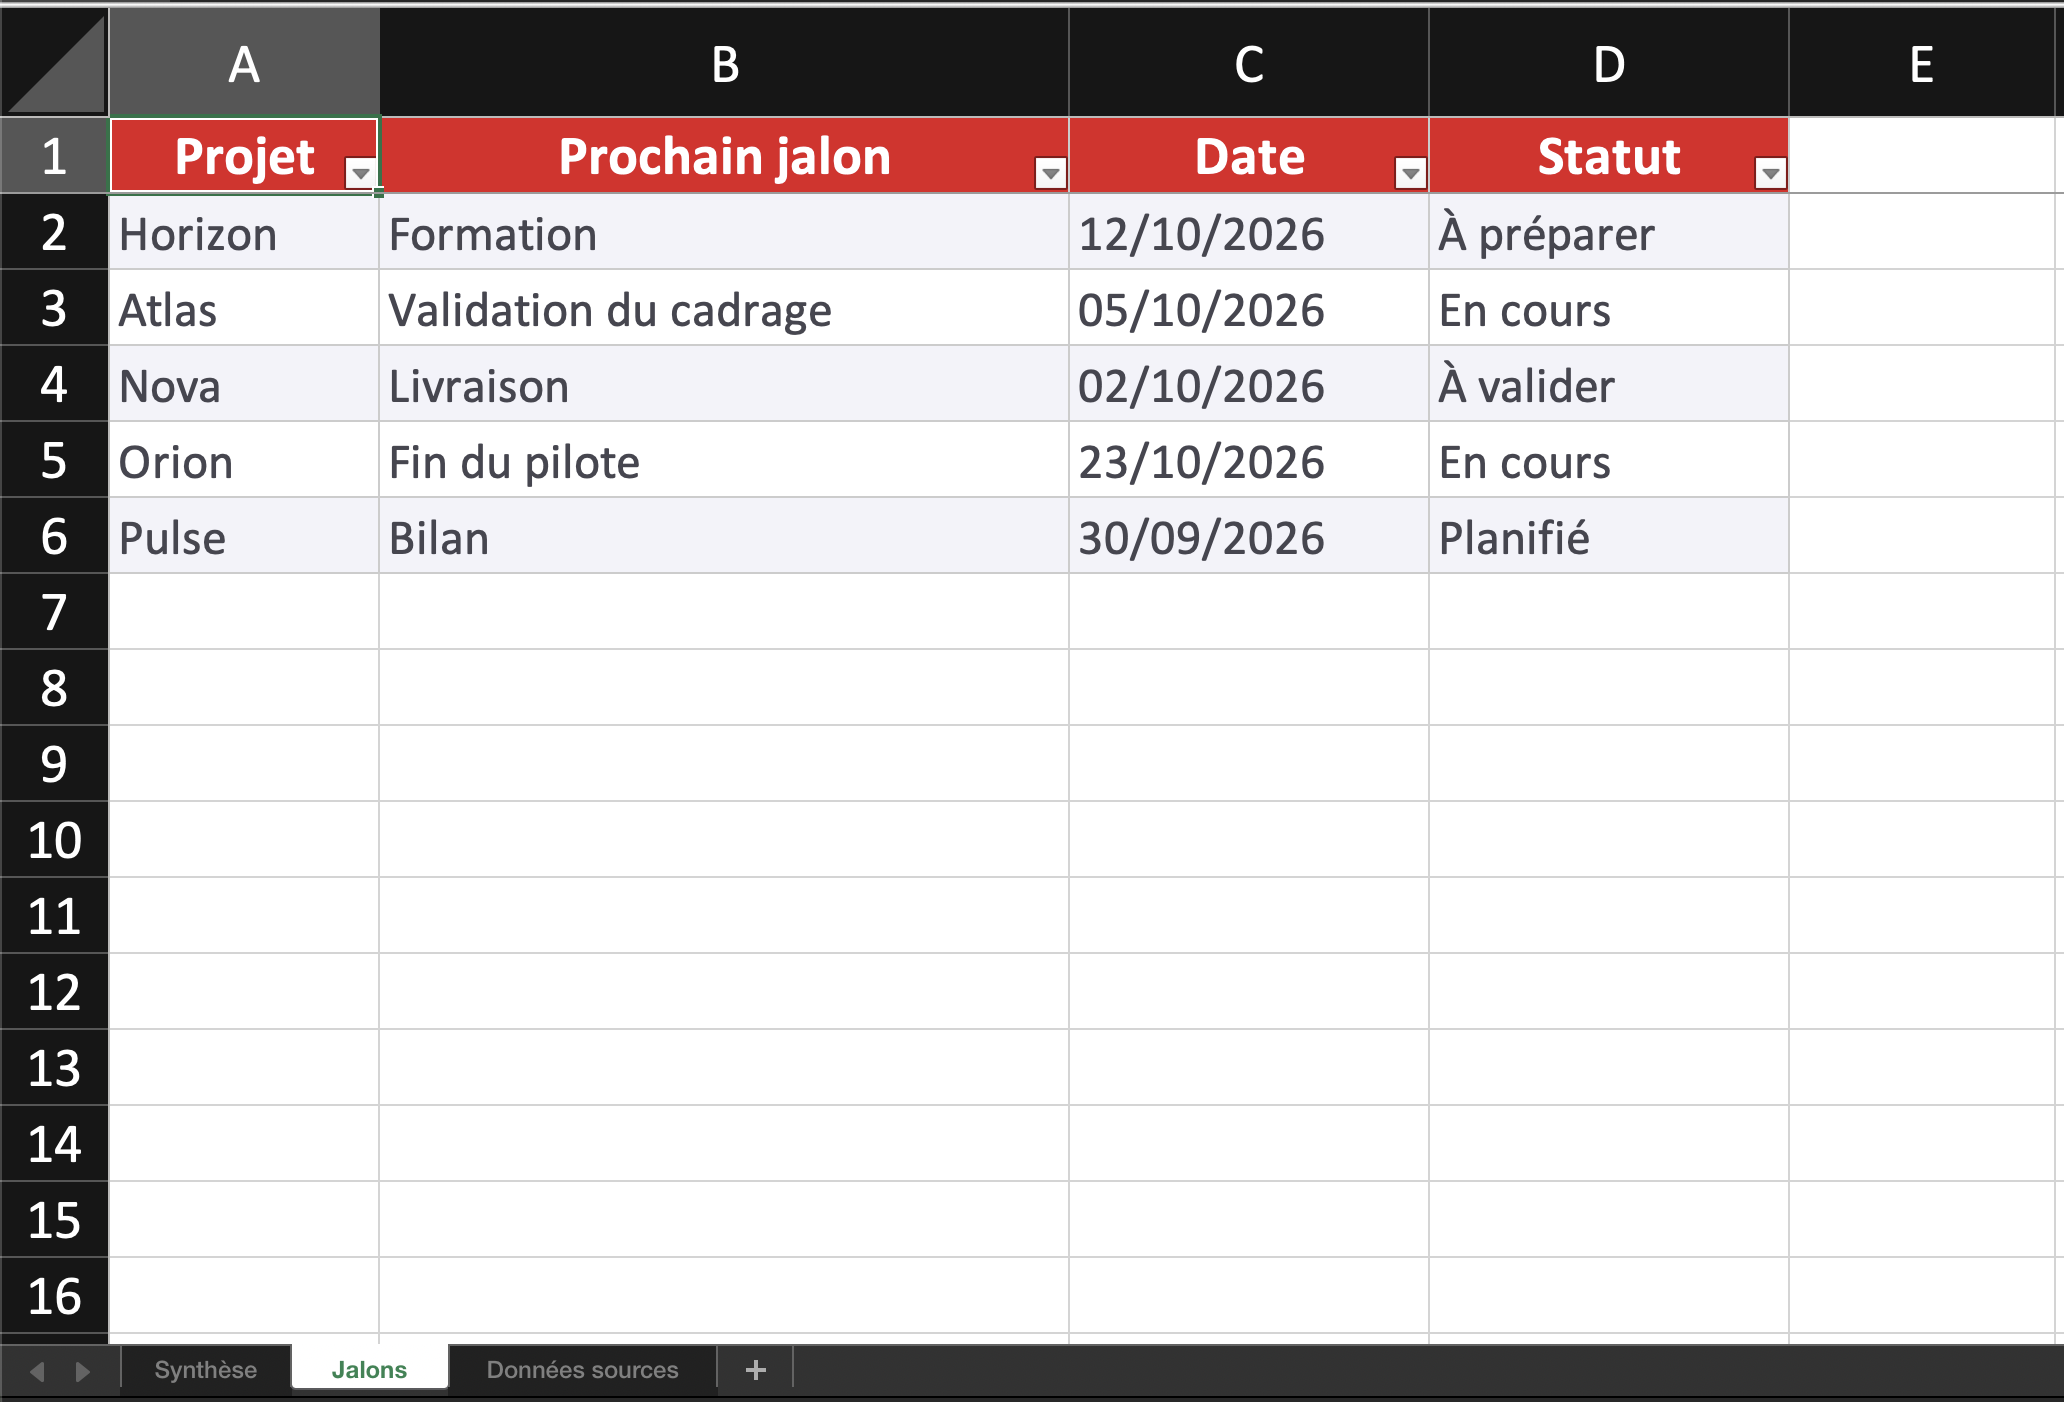
2. “Milestones”: a table with Project, Next milestone, Date, Status,
   and the following rows (dates are day/month/year):
   Horizon; Training; 12/10/2026; To prepare
   Atlas; Scoping approval; 05/10/2026; In progress
   Nova; Delivery; 02/10/2026; To approve
   Orion; End of pilot; 23/10/2026; In progress
   Pulse; Review; 30/09/2026; Scheduled
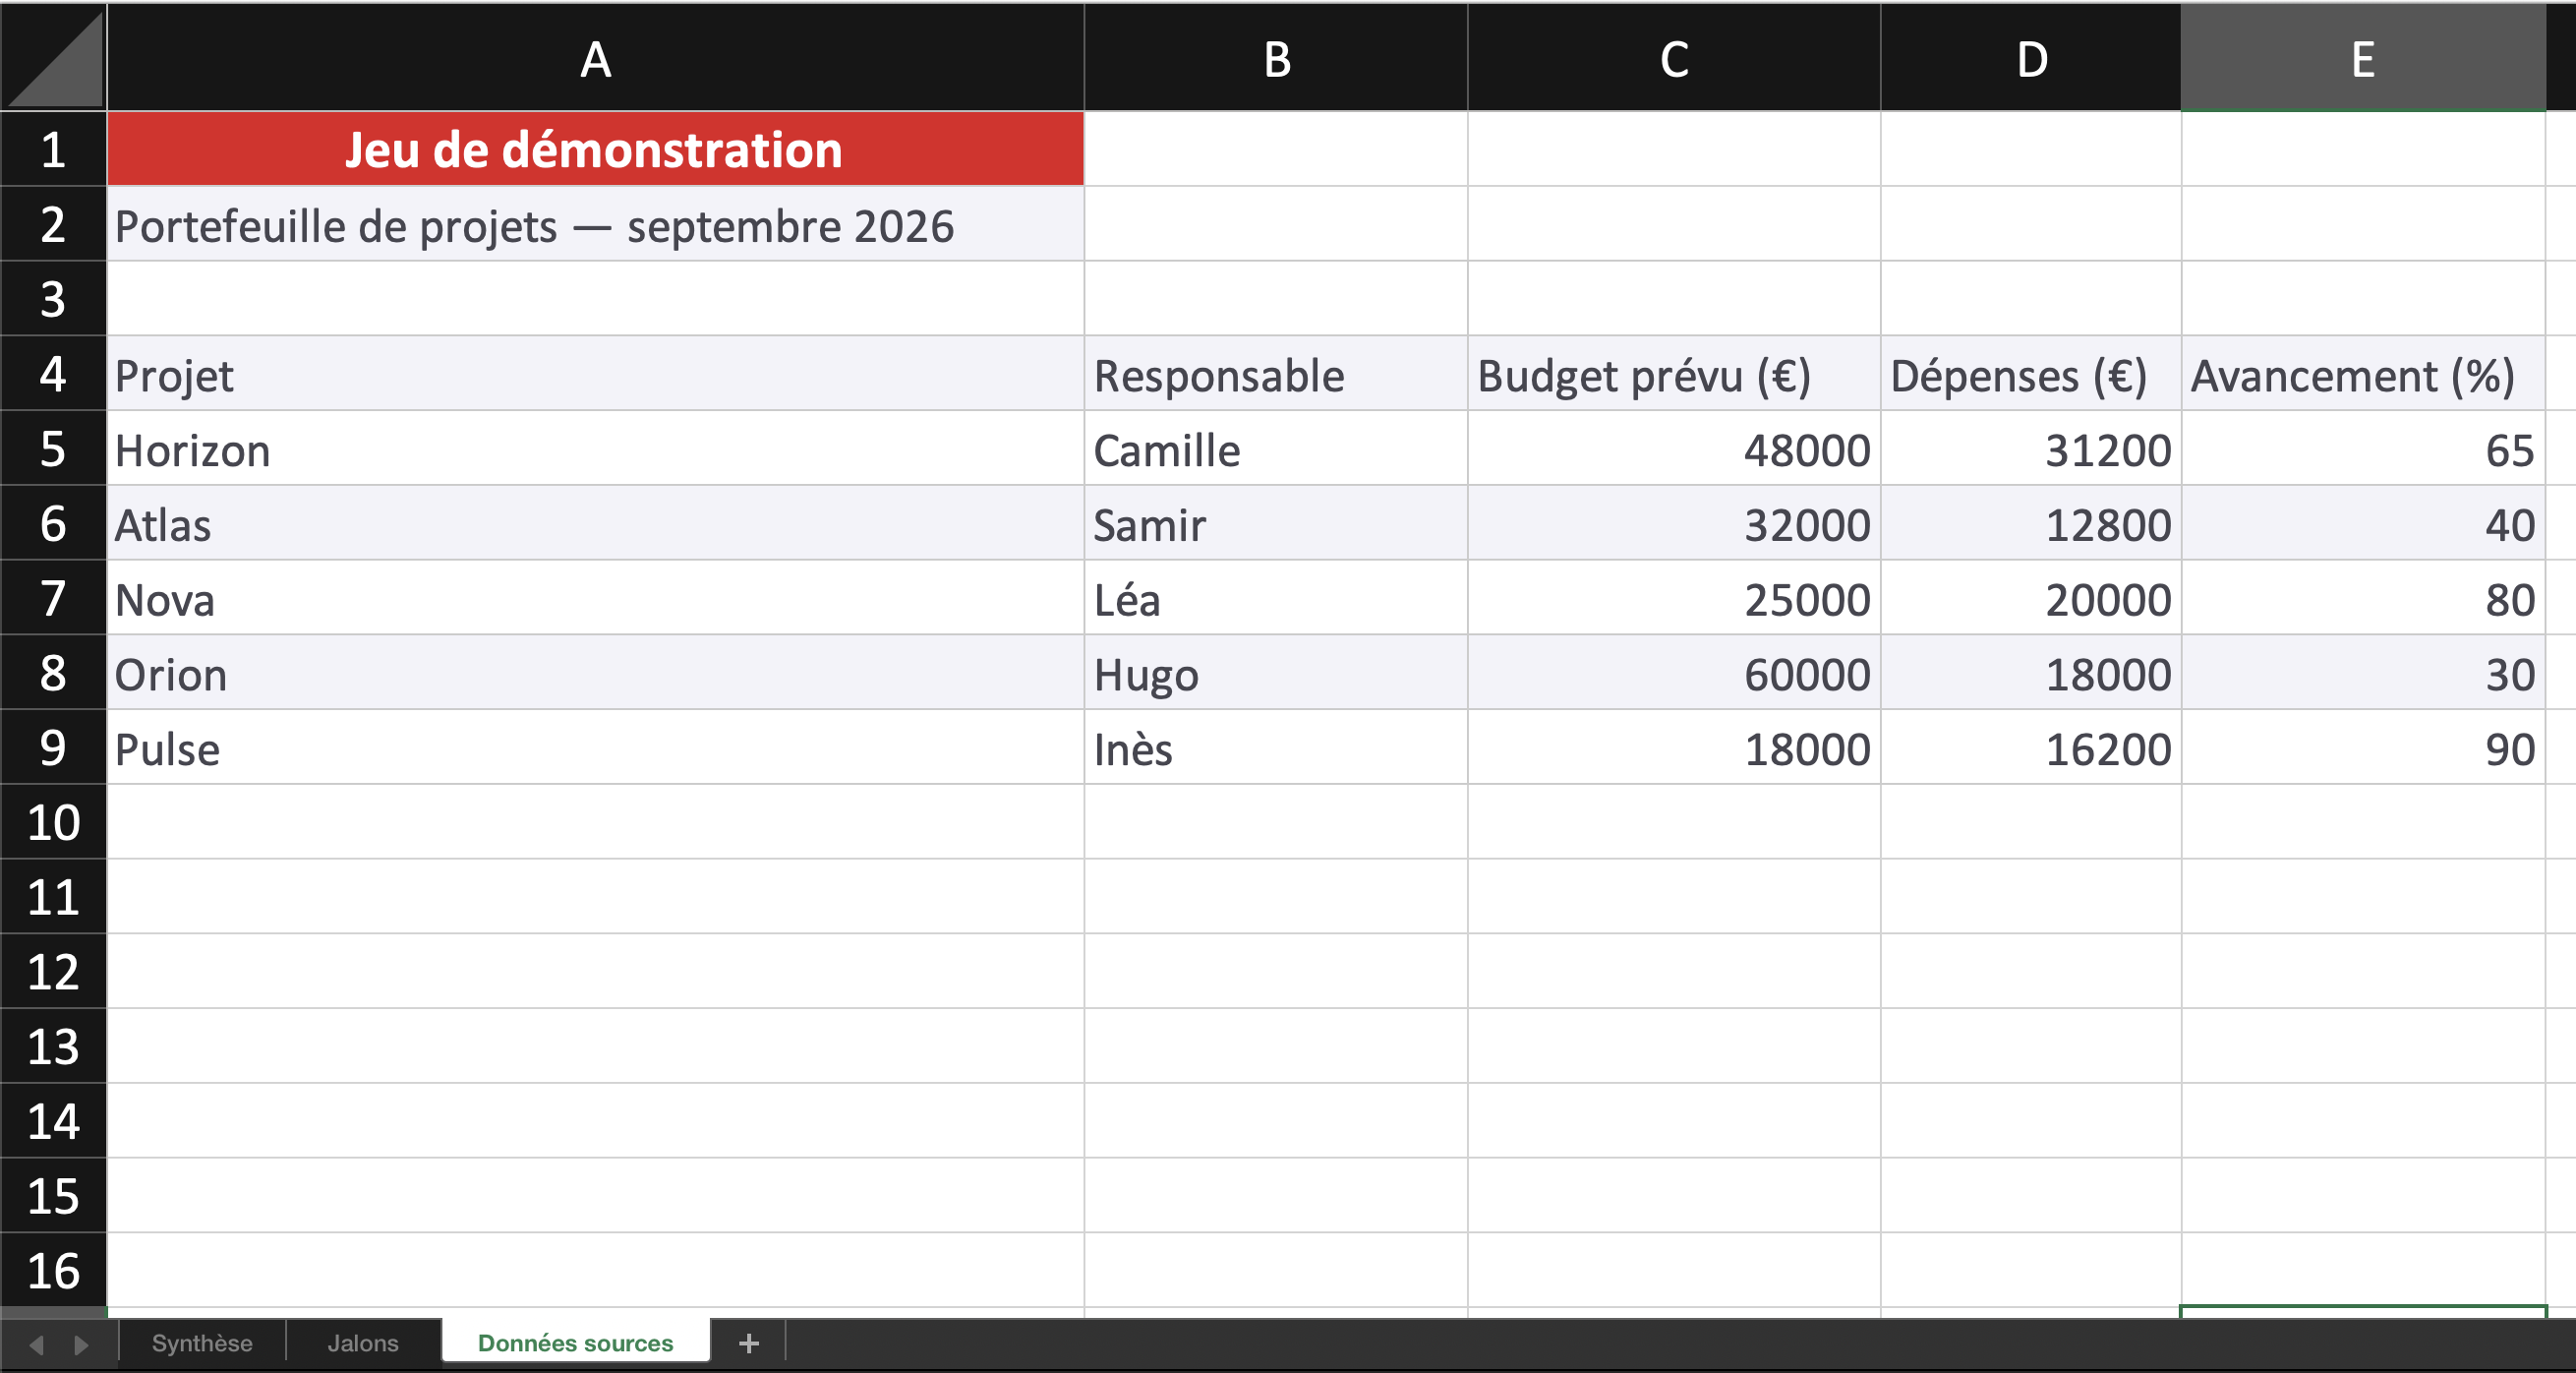
3. “Source data”: a copy of the initial data,
   identified as a demo dataset.

Use contrasting headers in the brand colors
and column widths suited to the content.
In Summary, freeze the header row and enable automatic filters.
Display euro amounts and progress percentages clearly,
for example 65% for Horizon, without changing their values.
Use only the supplied data, without adding calculations or formulas.
Give me the link to the .xlsx file.
The screenshots below show the three sheets of the workbook generated with this prompt. Click an image to enlarge it.
Features
More ideas to try
- Supplier comparison: “Use Claranet's brand guidelines (replace Claranet with your company name). Organize these offers into a workbook with Summary, Services, and Pricing sheets.”
- Training tracking: “Use Claranet's brand guidelines (replace Claranet with your company name). Create a workbook from this participant list, with one sheet per session and filters on the headers.”
- Inventory: “Use Claranet's brand guidelines (replace Claranet with your company name). Turn this equipment list into an Excel table with Equipment, Team, Location, and Status columns.”
Check and refine the result
Open the workbook and check sheet names, data, dates, amounts, and percentages. Test the filters and make sure the columns remain readable. The example names and figures are fictional.
To request a change, continue in the same conversation and specify the file, sheet, and columns concerned. For example: “In the Milestones sheet, widen the Next milestone column and display dates in day/month/year format.”
Other creation MCPs
- MCP Docs: PDF reports and Word documents.
- MCP Draw.io: diagrams and flowcharts.
- MCP PPTX: PowerPoint slide decks.